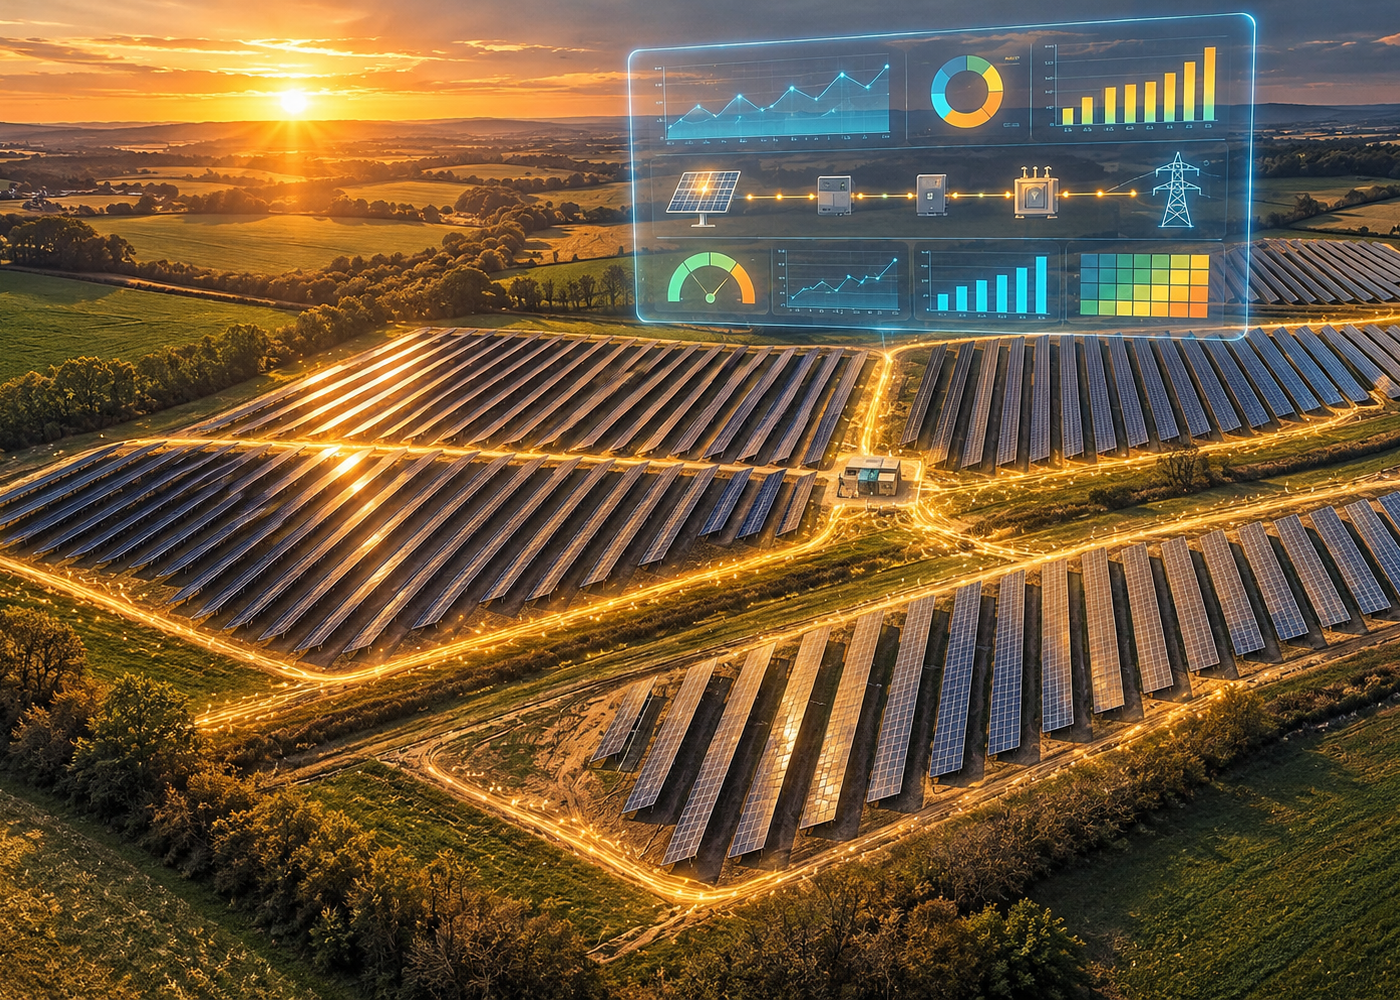
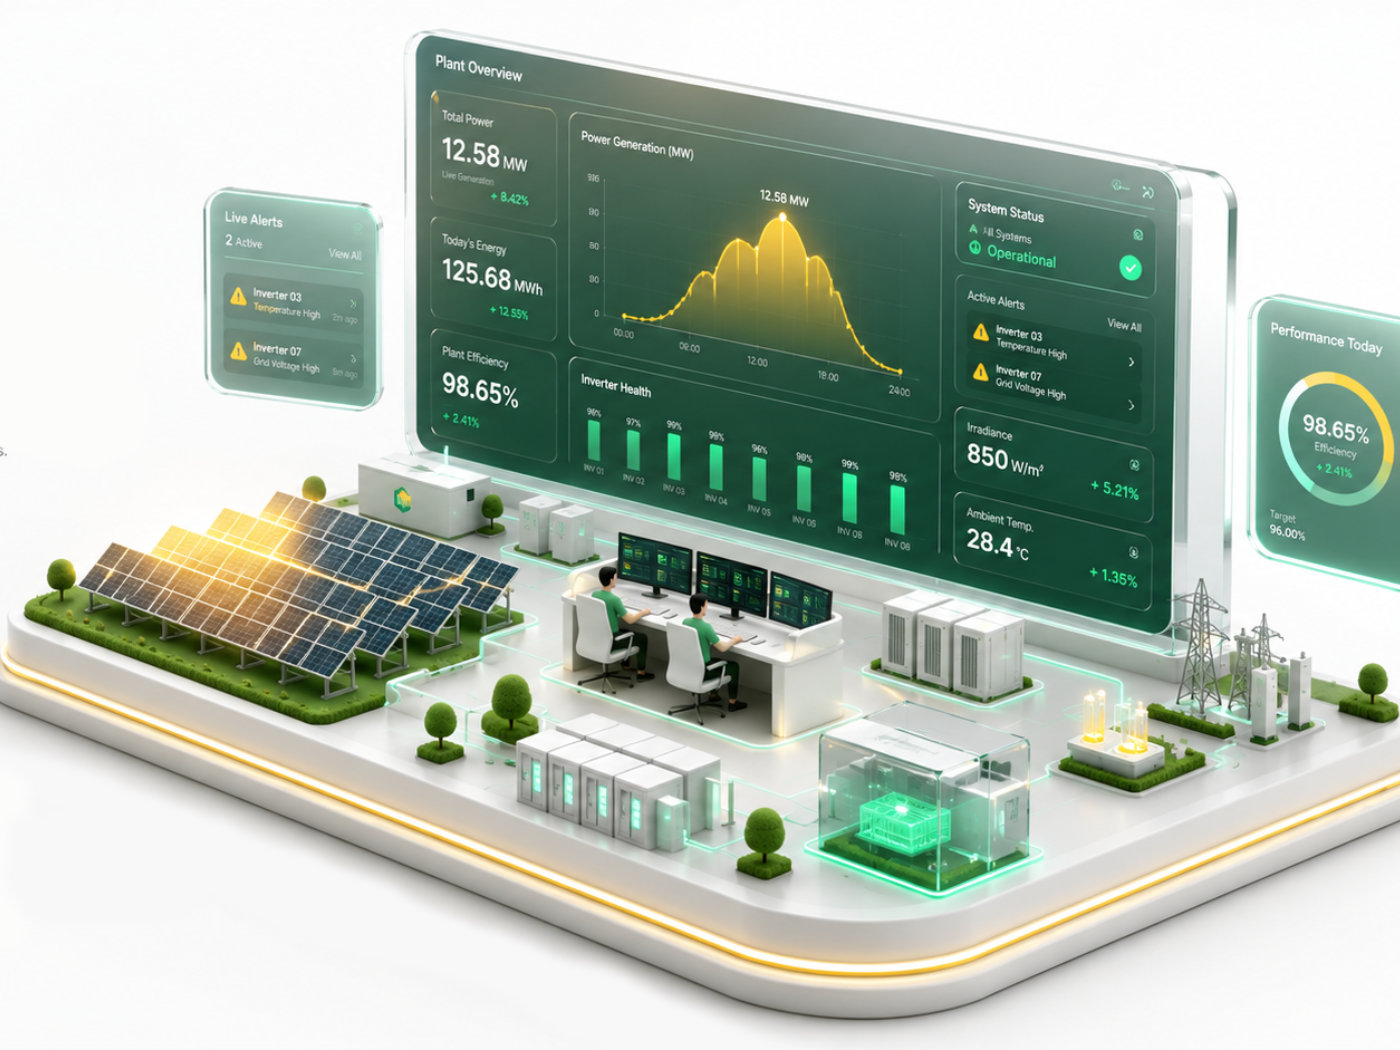
The difference between average and high-performing solar portfolios often comes down to the capabilities of the monitoring platform. The best systems go far beyond basic dashboards they deliver intelligent analytics, proactive alerts, advanced visualization, and automated maintenance planning.
In this article, we break down the 7 must-have features of modern smart solar monitoring software. These are the capabilities that consistently drive higher energy yield, lower operational costs, and better asset management at scale.
Advanced Report Builder
Raw data doesn’t win investor meetings or satisfy asset owners. Clear, accurate reports do. A solar monitoring software without a flexible report builder forces your team to export spreadsheets, clean them by hand, and rebuild the same charts every month.
An advanced report builder turns plant data into decision-ready documents in minutes. Look for a platform that lets you:
- Design custom report templates with the KPIs that matter: energy yield, performance ratio (PR), availability, losses, and alarms.
- Schedule automatic reports daily, weekly, or monthly, and deliver them to owners, O&M teams, and lenders.
- Tailor each report to its audience, from a technical deep-dive for engineers to a one-page summary for executives.
- Export in the formats you need and compare performance across plants, periods, and equipment.
The result is less manual work, consistent reporting across your entire portfolio, and faster, better-informed decisions. With Nexun’s Advanced Report Builder, your PV and BESS data becomes professional reporting without the spreadsheet effort.
Smart Algorithms for Performance Analytics
A plant can look “online” and still lose energy every day. Underperforming strings, soiling, inverter derating, and slow degradation rarely trigger an alarm, yet they quietly reduce your revenue. That’s why modern solar performance analytics must go beyond simple monitoring.
Smart algorithms compare actual production against expected output, corrected for irradiance and temperature, to reveal hidden losses automatically. A strong analytics engine should:
- Detect underperformance at plant, inverter, and string level before it becomes costly.
- Benchmark equipment against similar units on the same site to expose outliers.
- Identify likely causes, such as shading, soiling, faults, or degradation, rather than only flagging a symptom.
- Provide actionable tips so your team knows what to fix first.
Nexun combines intelligent algorithms with the expertise of an engineering team that designs, builds, and operates real PV and BESS plants. You get insights grounded in field experience, not just generic alerts, so every kilowatt-hour you produce is a kilowatt-hour you actually capture.
2D SLD & 3D WAMS Monitoring
Operators need two perspectives: the electrical logic of the plant and its physical reality. The best solar SCADA software gives you both in one interface.
2D SLD (Single Line Diagram) monitoring shows your electrical architecture live, from inverters and transformers to breakers and the grid connection point. You can see status, power flow, and faults at a glance, and control equipment safely from the same screen.
3D WAMS monitoring adds spatial awareness. Instead of searching through lists, your team can navigate the plant visually, move from site to block to equipment, and locate an issue exactly where it happens. That shortens fault-finding time and helps field crews reach the right asset faster.
Together, the two views offer:
- Faster fault localization and response
- Better situational awareness for control room teams
- A shorter learning curve for new operators
- A single, intuitive window into every asset
Event Management for O&M
In a busy solar plant, problems don’t arrive one at a time or politely. Inverter trips, communication losses, tracker faults, and maintenance visits all happen at once. Without a structured O&M event management system, that information lives in chat groups, notebooks, and spreadsheets, and nobody has a single, reliable view of what is open, who owns it, and what has already been tried.
A real-world example: An inverter trips at 10:40 on a large PV site.
- Without smart software: The alarm appears in a vendor portal that few people check. A technician notices it hours later during rounds, reports it in a messaging app, and fixes it. Nothing is recorded properly. Next month, the report shows a drop in energy, but no one can say why, and the same fault returns unnoticed.
- With Nexun: The event is logged automatically with time, equipment, and severity. It is assigned to the on-duty technician, tracked from “open” to “resolved,” and stored in that inverter’s history. When the same fault appears again, the pattern is visible immediately.
A smart event manager gives your O&M team accountability, a complete maintenance history, and the evidence to explain every loss. That means faster resolution today and fewer repeat failures tomorrow.
Smart Alert System
An alert is only useful if the right person sees it at the right time and can tell what matters. Basic monitoring does the opposite: it either stays silent about slow, costly losses or floods operators with hundreds of notifications until they stop paying attention.
A real-world example: A grid outage hits your plant, and a separate string begins underperforming on the same day.
- Without smart software: Forty inverters raise forty separate alarms within seconds. The operator scrolls through the list, and the quiet string problem gets lost in the noise. It is found weeks later during a monthly review, after the energy is already gone.
- With Nexun: The forty alarms are grouped into one critical event, “grid loss,” with the root cause clearly shown. Separately, an alert flags the underperforming string because its output is lower than comparable equipment under the same irradiance, even though no hard fault occurred.
A smart alert system prioritizes by severity, groups related events, learns what “normal” looks like, and routes notifications to the right role by email, SMS, or app. Your team stops chasing noise and starts reacting to what actually costs money.
Production Forecast & Smart Maintenance
Maintenance always costs something. The question is whether you pay for it with production or avoid doing so. Without a solar production forecast, planning is guesswork, and maintenance gets scheduled around calendars and habit instead of around energy.
A real-world example: Your team needs to clean panels and inspect a transformer next week.
- Without smart software: Work is scheduled by a fixed calendar, so a shutdown lands on the sunniest, highest-production day of the week. The plant loses energy it could have sold, and the team only discovers the cost afterward.
- With Nexun: The forecast shows which days will be sunny and which will be low-yield. The platform proposes a maintenance plan that places planned shutdowns in the lowest-production window. Actual output is then compared with the forecast, so any gap becomes an early warning rather than a surprise.
Forecast-driven, smart maintenance also supports better planning for grid commitments and battery charging in PV and BESS plants. Maintenance becomes cheaper, more predictable, and less disruptive to revenue.
Centralized Multi-Site Dashboard & Remote Control
Once you operate more than one plant, the real challenge isn’t monitoring a single site. It’s keeping a clear picture of all of them at once. When each plant has its own portal, its own login, and its own way of presenting data, your team spends more time switching between systems than solving problems.
A real-world example: You manage five plants across different regions, and one of them needs a breaker reset and a power limit change during a grid curtailment request.
- Without smart software: Someone logs in to separate vendor portals to find out which site is struggling. Then a technician drives to the plant to operate the equipment on site, or waits for a local contact to do it. The curtailment window is half over before the action is complete.
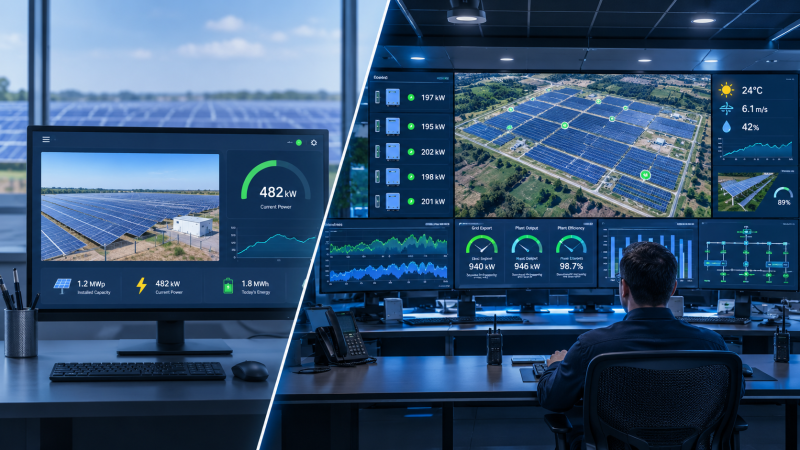
- With Nexun: One multi-site solar dashboard shows every plant’s production, availability, and active events side by side. The operator spots the affected site, drills down to the equipment, and carries out the control action remotely, within the permissions of their role.
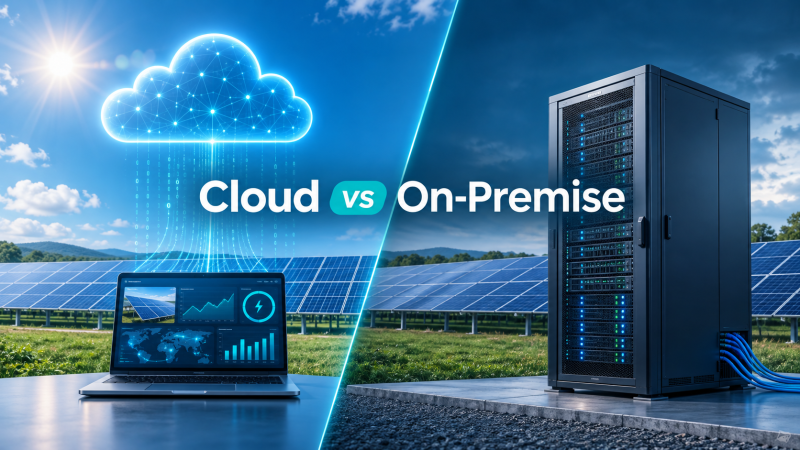
A strong platform also adapts to the person using it. Executives see portfolio KPIs, control room teams see live equipment status, and field technicians see their own tasks. It should run wherever your operation needs it, in the cloud, on your own hardware, or on a mini PC, and be accessible from any device. Because remote control carries real responsibility, look for role-based permissions and a full record of who did what and when.
Choose Software That Works as Hard as Your Plant
A solar plant is built to produce energy, and monitoring software should protect every kilowatt-hour of it. The seven features covered here work together: advanced reporting that explains your results, smart analytics that uncovers hidden losses, 2D and 3D visualization that shows you exactly where to look, event management and smart alerts that keep your team focused, forecast-driven maintenance that protects revenue, and a centralized dashboard with remote control that scales across your portfolio.
When you evaluate a solar monitoring platform, ask a simple question:
does it only display data, or does it help your team act on it?
The difference shows up in uptime, in maintenance costs, and in the returns of every plant you operate.
Nexun was built by solar engineers who design, build, and operate PV and BESS plants, so every feature reflects real operating needs. Ready to see it in action? Book a demo and discover how Nexun can simplify the way you run your plants.
Write a comment